Observability
p2pstream records operational data for traffic flow, proxy health, agent state, policy decisions, and live request tracing.
What It Is
Observability combines retained proxy request events, agent stats, dashboard summaries, and an admin-controlled trace stream.
When It Matters
Use observability when checking whether traffic is flowing, which routes are hot, which agents are serving requests, why a request failed, or whether cache/WAF/rate/shaping policies were selected.
Runtime Behavior
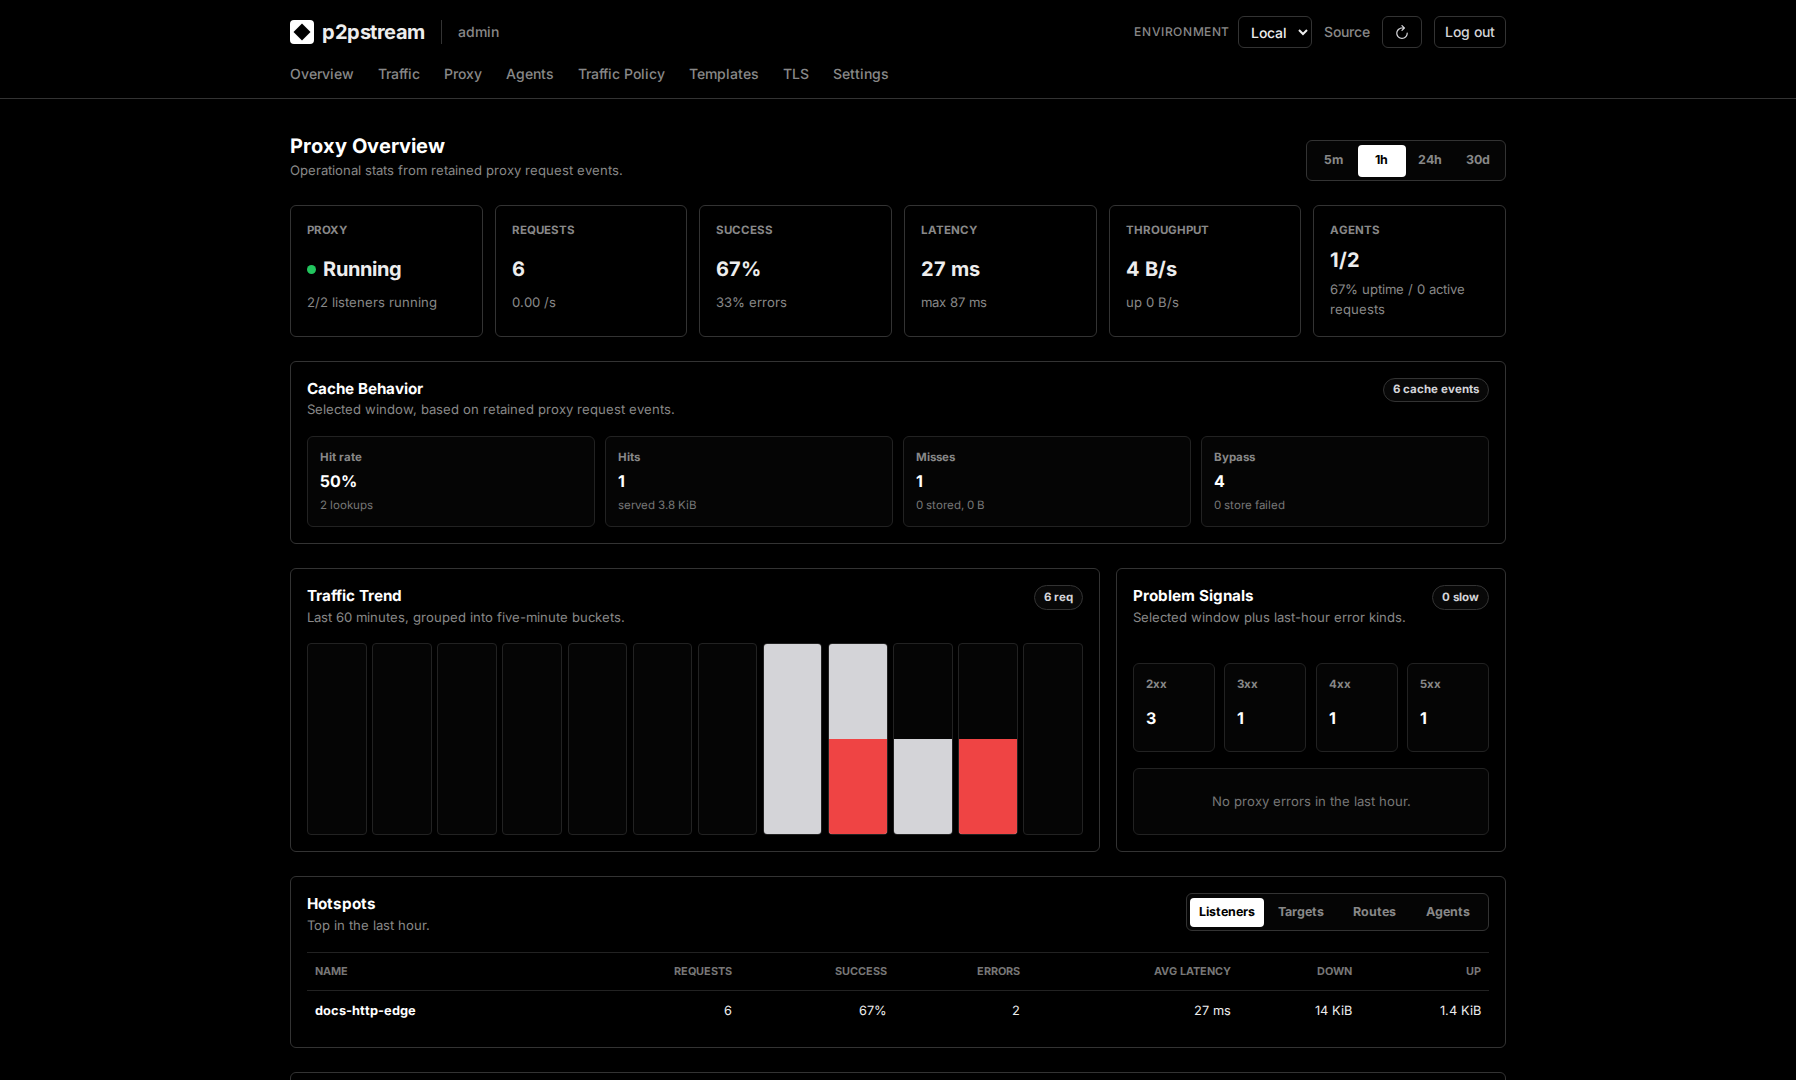
The Overview page summarizes retained proxy request events over 5m, 1h, 24h, and 30d. The retention window is controlled by:
OBSERVABILITY_RETENTION_DAYS=30Proxy request events include status code, duration, error kind, listener ID, route ID, route target ID, WAF rule/action, cache rule/status/bytes, agent ID, request bytes, and response bytes. The route-target-only migration resets retained proxy request events and proxy rollups so legacy backend IDs are no longer kept. Agent stats history is not reset.
Agents report memory, CPU percentage, goroutine count, active requests, request outcome counters, bytes received, and bytes sent.
Traffic tracing levels (tracing records every matching request; the Traffic Flow visualization may display a sampled subset of recorded paths so busy systems remain readable):
| Level | Includes |
|---|---|
| Basic | High-level request stages. |
| Detailed | Host, query, WAF decision, origin, target type, and error kind. |
| Headers | Request and response headers, redacted where known. |
| Debug | More detailed event attributes. |
Use Headers and Debug temporarily because they can expose operational details and request metadata, including Authorization tokens and session cookies.
Common Mistakes
- Leaving high-volume tracing enabled after troubleshooting.
- Expecting deleted old events to remain beyond
OBSERVABILITY_RETENTION_DAYS. - Looking only at Overview when Traffic tracing is needed for stage-level behavior.
Related Links
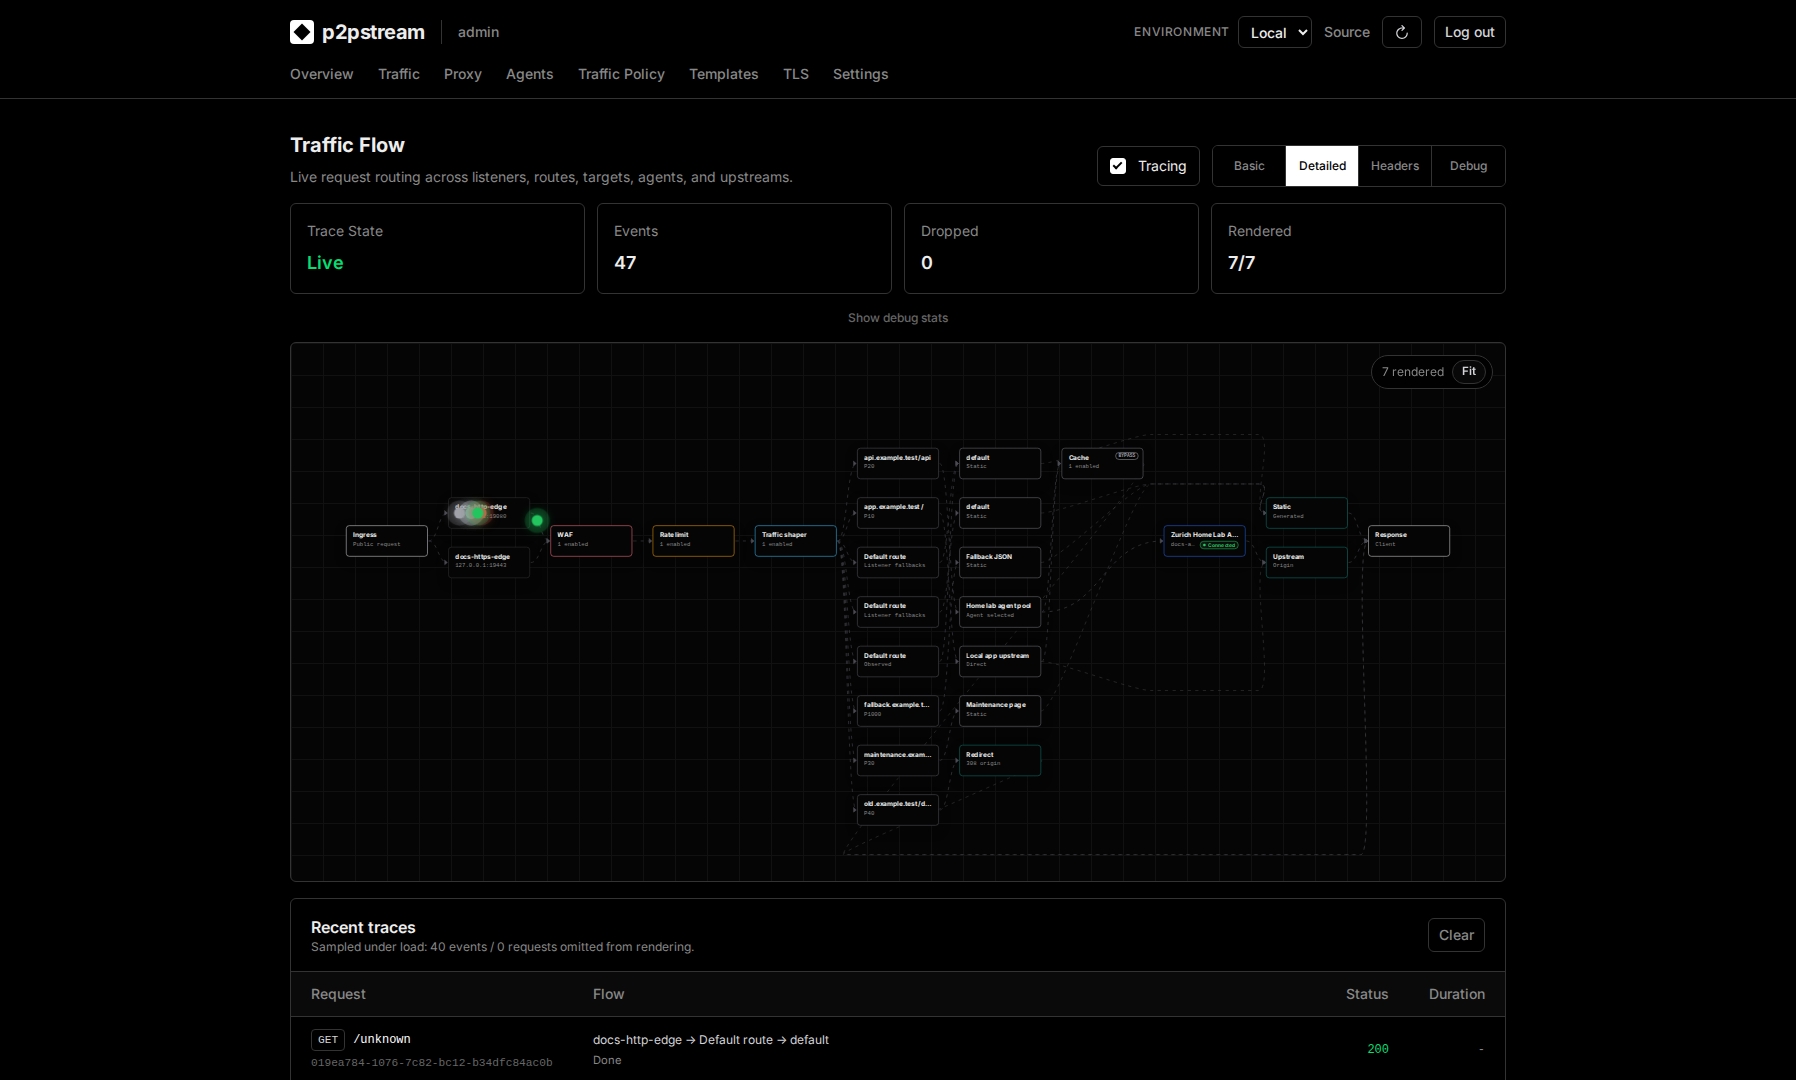
The request details modal complements the flow diagram when one stage needs deeper inspection. Use it to check timing, selected rule and target IDs, cache status, response metadata, and the trace attributes available at the selected tracing level.