Trace Live Traffic
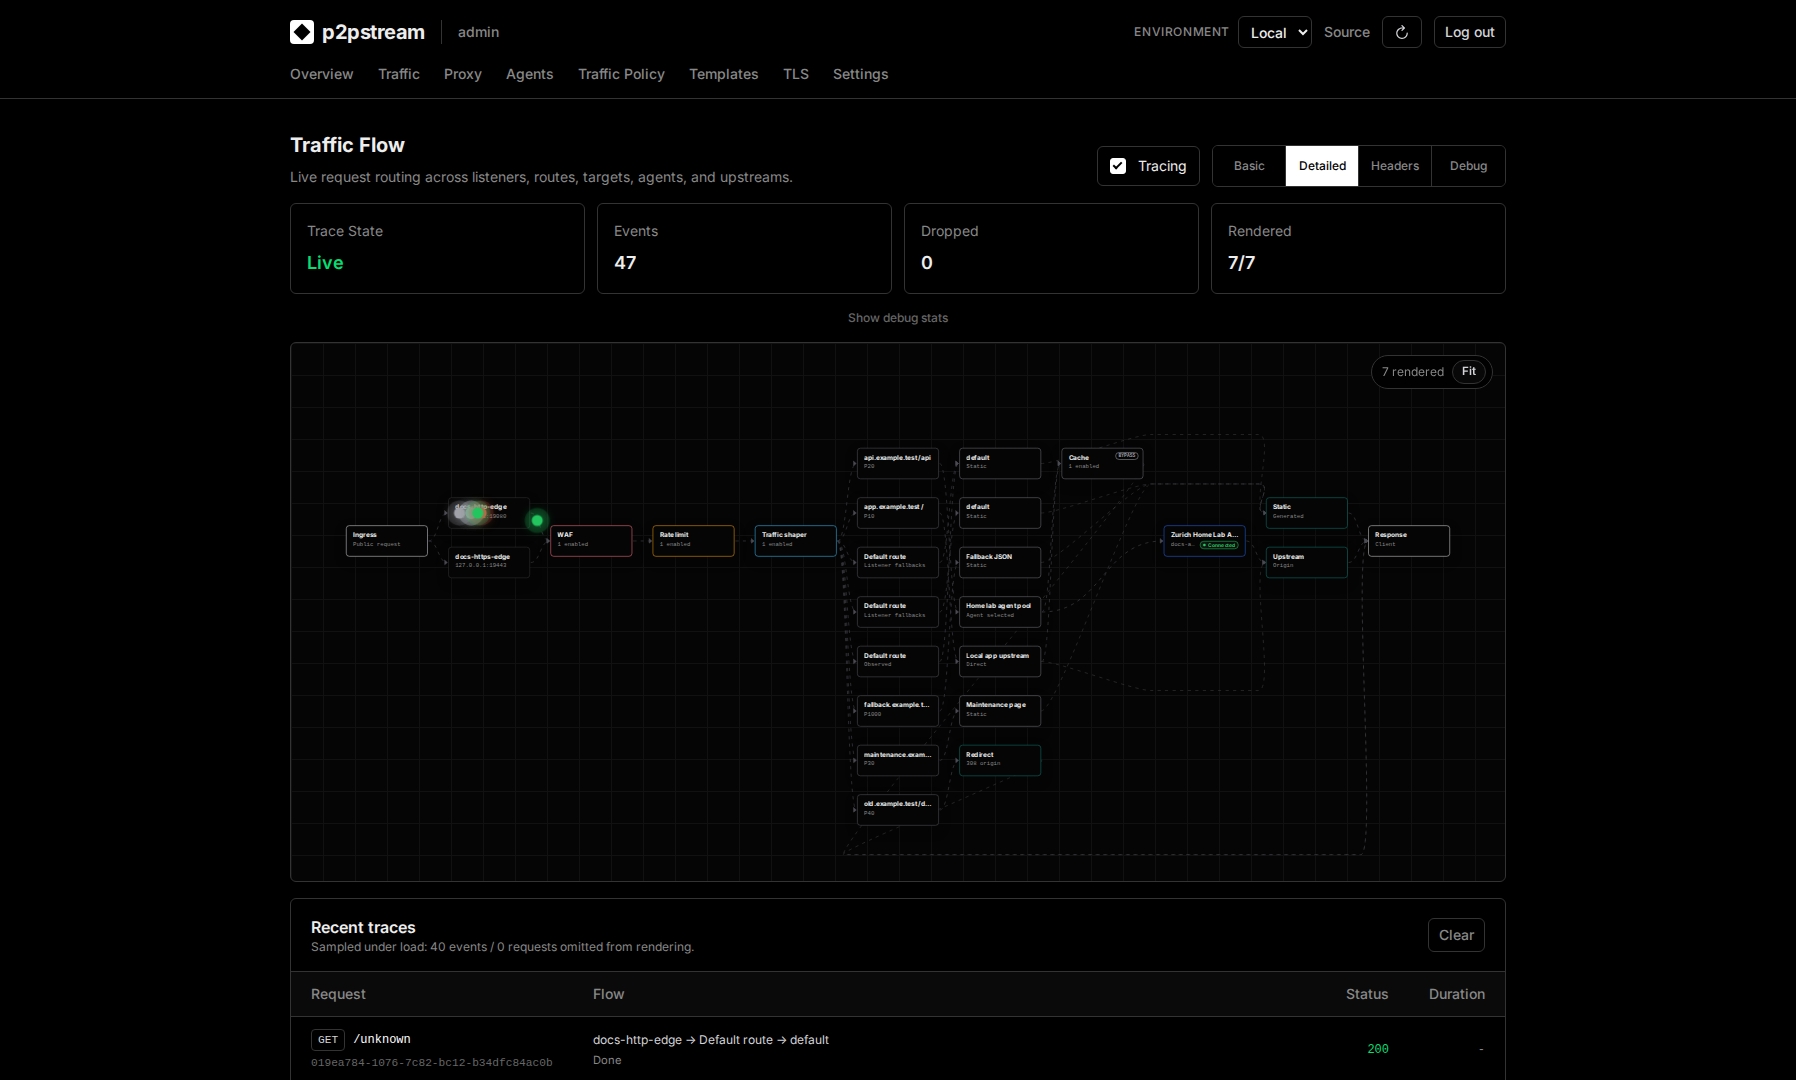
Use the Traffic page to see how a live request moves through listeners, WAF, rate limits, shapers, routes, targets, cache, agents, origin connections, and responses.
Use This When
Use tracing while diagnosing why a request did not match a route, hit a target, use cache, pass WAF, or select the expected agent.
Prerequisites
- You are logged in to management.
- The client request reaches a p2pstream public listener.
- You can reproduce the request while tracing is enabled.
Steps
Open Traffic.
Enable Tracing.
Select a level:
Level Use Basic Confirm requests are received and completed. Detailed Diagnose route, target, cache, and agent selection. Headers Inspect selected request/response headers. Debug Temporary deep troubleshooting. Headers and Debug log sensitive data
Headers and Debug levels capture request and response headers, which can include
Authorizationtokens, session cookies, and API keys. Use them only while actively diagnosing an issue and reset to Basic or Detailed when done.From another shell, reproduce the request:
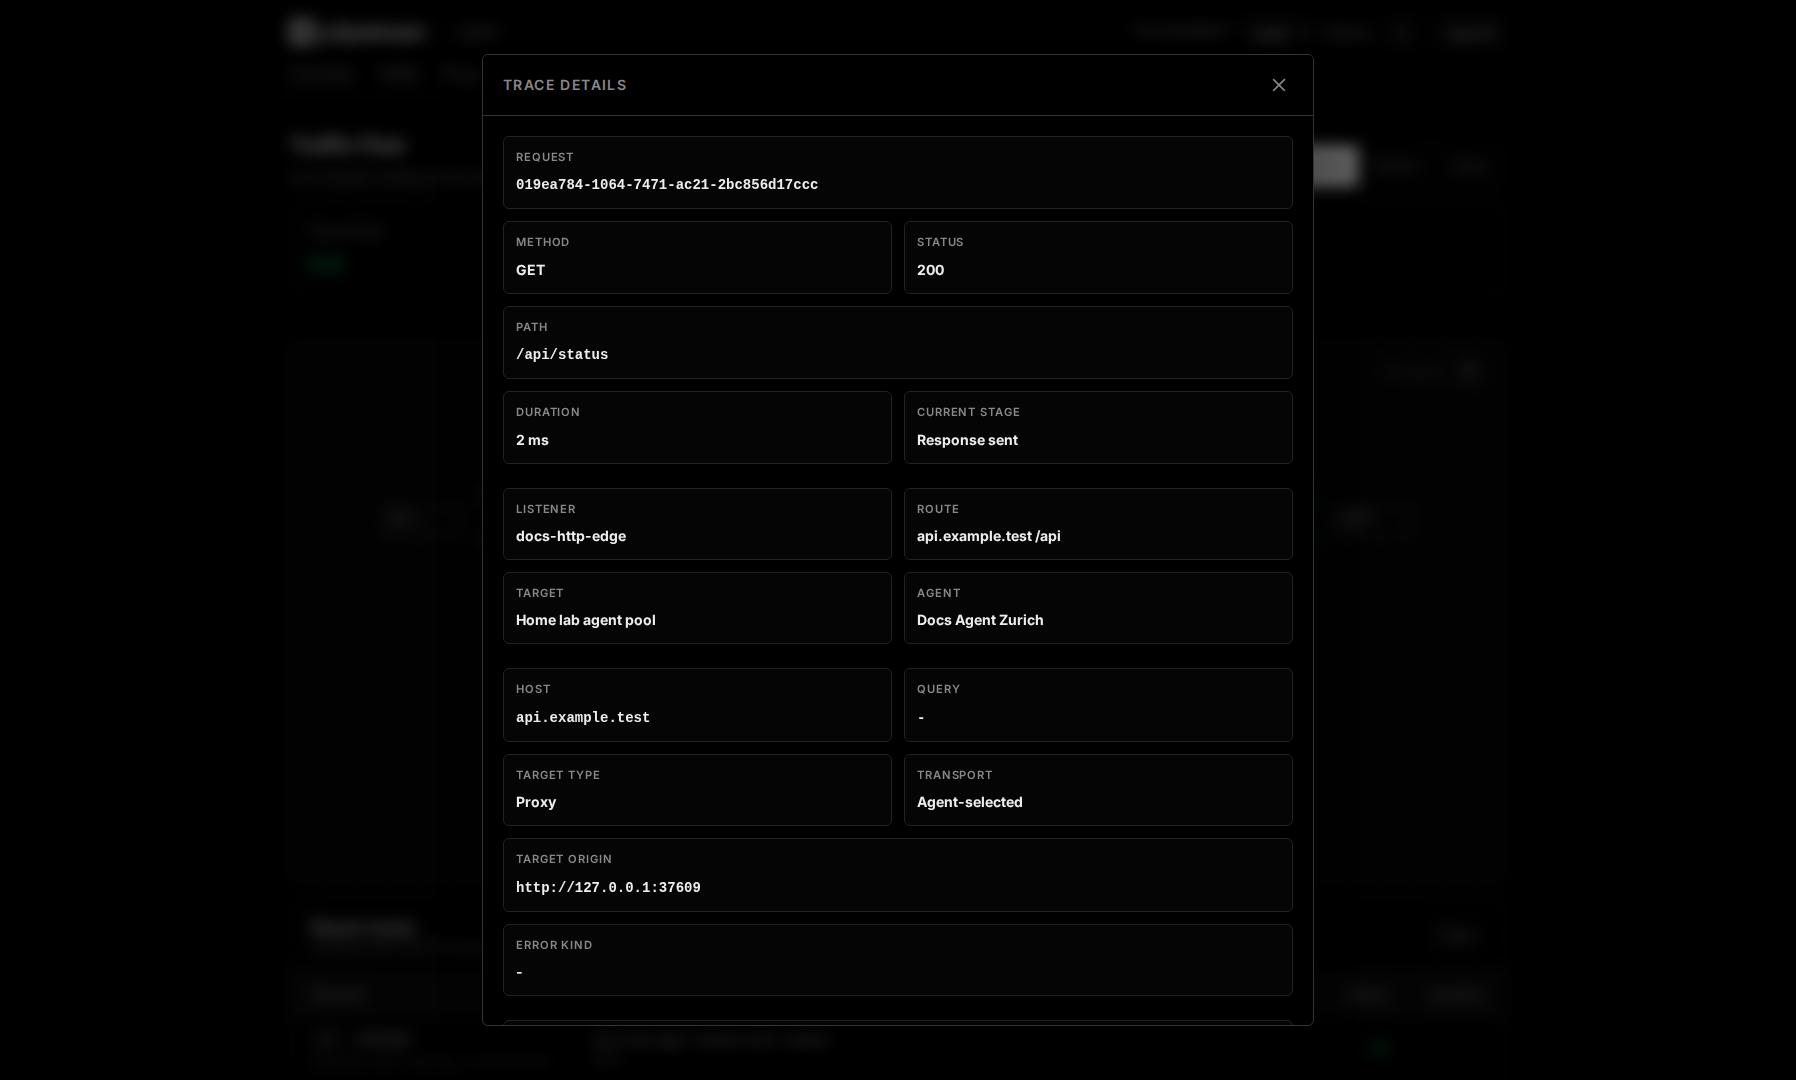
bashcurl -v https://app.example.com/api/healthSelect the request in Traffic Flow and inspect stages and details.
Runtime Effects
Traffic tracing is an admin-controlled live stream. It is meant for temporary diagnosis. Turn tracing off when finished, especially at Headers or Debug level.
Common stages include received, WAF evaluated, rate limited, route resolved, target selected, cache lookup, cache hit, cache miss, cache bypass, cache stored, agent selected, upstream started, upstream responded, response sent, and failed.
Verification
A matching request should appear in Traffic Flow shortly after you reproduce it. Cache is shown as a decision gateway after target selection: hits exit to response, misses and bypasses continue to the direct upstream or selected agent.
Troubleshooting
| Symptom | Check |
|---|---|
| Request does not appear | Confirm tracing is enabled and the request hits a p2pstream public listener. |
| Expected asset is not cached | Check cache rule match, Cookie, Authorization, origin cache headers, status code, and object size. |
| Stream reconnects | Check management network, auth session, server restarts, and trace volume. |